

Performance
The script is not in the frame is the claim the runtime is built on. This page is what follows from it: once a repaint no longer runs JavaScript, the cost that is left has a shape small enough to write down.
script cost = how often a View is invalidated × what describing that View costsNeither factor is the frame rate. A window repainting at 120 Hz runs no more JavaScript than one repainting at 30 Hz, and a View nobody has invalidated runs none at all. Both factors are yours: the left one is where you call cx.notify(), the right one is how much interface sits behind a single call.
Everything below is one of those two, or a way of telling which is the problem.
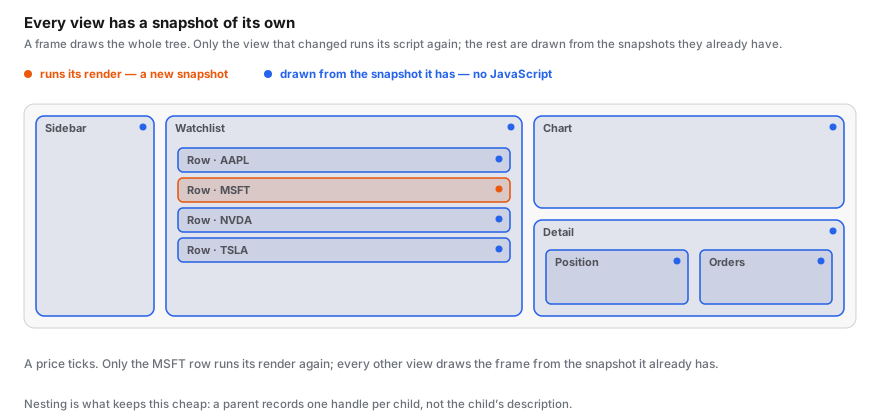
Every View has its own Snapshot
GPUI Shell gives each JavaScript View a Snapshot of its own: the description that View's render produced, kept in Rust.
A View's Snapshot is reused until that View changes. Every frame in between is drawn from it — turned into GPUI elements, laid out, painted — entirely in Rust. No JavaScript runs.
the View changed  ──▶  render()  ──▶  a new Snapshot  ──▶  frame
the View did not  ─────────────────▶  the Snapshot it has  ──▶  frame
Snapshots are per View, not per window. A window holding a hundred Views holds a hundred Snapshots, and each one is invalidated on its own:
| What happens | What runs |
|---|---|
Watchlist calls cx.notify() | Watchlist.render, and nothing else |
The parent calls cx.notify() | The parent's render. Each child answers the frame from its own Snapshot |
this.chart.set_props({ symbol }) | That child's update and render. The parent is not rebuilt |
A child of a child calls cx.notify() | That child's render. Invalidation does not travel upward |
| The theme changes | Every View, because a Snapshot bakes in the colours it was built with |
Split a large View into small ones
A View is rebuilt whole. There is no partial rebuild inside one: if a View's description is four hundred nodes, any change rebuilds all four hundred, however small the change was.
That is what makes a large View expensive. Everything it draws shares one Snapshot, so the data that changes most often invalidates the parts that never change along with it. In a market terminal, one price moving re-describes the chart, the sidebar and the order book too — not because they changed, but because they sit inside the same View.
Splitting is the fix. Give each part that changes on its own a View of its own with cx.new, and a change reaches one Snapshot instead of all of them:
import { View } from "gpui";

export default class Terminal extends View {
  init(props, cx) {
    this.sidebar = cx.new(Sidebar);
    this.watchlist = cx.new(Watchlist, { symbols: props.symbols });
    this.chart = cx.new(PriceChart, { symbol: props.symbols[0] });
    this.detail = cx.new(Detail, { symbol: props.symbols[0] });
  }

  render() {
    return h_flex()
      .child(this.sidebar)
      .child(this.watchlist)
      .child(v_flex().child(this.chart).child(this.detail));
  }
}
On the 40-row watchlist this page measures, describing the whole panel costs 0.315 ms and describing one row costs 0.012 ms — 361 nodes against 9.
Nesting itself costs almost nothing to weigh against that: a parent records a handle per child, not the child's description. So a complex interface is not, by itself, a performance problem. A large View is.
And splitting for performance means splitting into Views — not into plugins, applications or processes. Reach for a second application when you want a second authority, which is Capabilities, not when you want a second cache.
Notify what a reader can see
cx.notify() is the whole dependency system, and it means one specific thing: my description is out of date. It is not an event notification, and using it as one is the most common way to make a script expensive.
A feed handler is the usual case:
onQuote(quote, cx) {
  this.quotes.set(quote.symbol, quote);
  cx.notify();                  // every tick, including the ones nobody is looking at
}
If the View draws twenty symbols out of a subscription of two thousand, that notify pays for a full description of the panel on every tick of every symbol it does not draw. The fix is a condition, not a faster render:
onQuote(quote, cx) {
  this.quotes.set(quote.symbol, quote);
  if (this.visible.has(quote.symbol)) cx.notify();
}
Three rules follow from the same idea:
- Invalidate the View that changed. State that belongs to one child should live on that child and be notified there, rather than on the parent that mounts it.
- Notifying more often than the frame rate costs nothing extra. See below — batching by hand buys nothing, conditioning does.
- From the host,
cx.notify()andScriptView::refreshare different requests. A barenotifyrepaints the description that already exists. If Rust changed state the script reads through a HostModule, the description is stale and onlyrefreshsays so. See Hosting.
What notify does, and what coalesces it
cx.notify() rebuilds nothing. It sets a flag on the View saying its description may be stale, and asks GPUI to draw. The rebuild happens later, inside the frame, and only if the flag is still set.
So every notify between two frames collapses into one render — whether they came from three event handlers, from a task in a loop, or from the host:
notify notify notify ──▶ one frame ──▶ one render()Setting a flag three times is setting it once. Nothing is dropped: all three handlers ran and all three changed state; what they share is the single rebuild that follows.
That puts a ceiling on what invalidation can cost: at most one script render per View per frame. A feed ticking a thousand times a second costs at most 120 renders a second on a 120 Hz display, not a thousand. It is why an over-eager notify shows up as wasted work rather than as a runaway.
The runtime adds no throttle of its own on top of that, and there is none to tune. The coalescing is GPUI's own scheduling, and it never defers a rebuild past the next frame — so it costs no latency, which is the other half of the pair below.
What the cache costs in memory
A View holds two descriptions: the one it published, and the one it replaced. The second is kept a moment longer because an event can still be dispatched against a frame that has already been superseded, and the handlers that frame needs belong to that older description.
There is no third. Publishing a new description drops the oldest, and dropping it retires the callbacks registered with it. So the ceiling is two descriptions per live View, and nothing accumulates with time: a View that has re-rendered a million times holds exactly what a View that rendered twice holds. Closing a panel drops its View, and both of its descriptions go with it.
This is the other reason to split a large View rather than fear splitting: a hundred small Views hold a hundred small pairs, which together are the same interface described twice — not a hundred times.
Frame rate and presentation latency are different failures
Two things can be wrong with a running interface, and only one of them shows up as FPS:
Rendering FPS          is the frame smooth?
State → presentation   how long after state changes does the reader see it?
Missing a cx.notify() costs no frames at all. GPUI keeps replaying the last good description at full rate, so the HUD reads a steady 120 FPS while the interface is showing something that stopped being true — and then jumps a quarter of a second later, when something unrelated invalidates the View. Every rendering measurement calls this healthy.
| Symptom | Which number is wrong | Usual cause |
|---|---|---|
| The window stutters while nothing in the application is changing | FPS | Description too large per frame, or a virtual list doing per-row work; see the measurement |
| The window stutters while a feed is running | FPS and invalidation | One boundary being rebuilt too often, too large, or both |
| The window is smooth and the data is late | Presentation latency | A notify that was skipped, deferred behind an await, or issued as a host cx.notify() where refresh was meant |
Diagnose them separately. An FPS reading that never dropped is not evidence that invalidation is correct.
Reading the counters
The runtime counts the two events apart, and the host can read them with runtime.read_metrics() — see Watching what it costs for the API and the delta-against-a-baseline pattern that turns them into per-second rates.
| Reading | The question it answers |
|---|---|
script_renders() | How often JavaScript ran. Follows cx.notify(), reloads and theme changes — never frames |
materializations() | How often a Snapshot became elements. Follows frames |
mean_script_render() | What one description costs, host calls included |
mean_native() | How much of that was inside HostModule functions rather than describing |
slowest_script_render() | The worst single build in the run |
frame_script_calls() | Entries into the VM from the frame path — virtual list item renderers and dock chrome handlers, which are the only two |
structure_repeat_rate() | Of the rebuilds that had a predecessor, what fraction described the same shape — see below |
What the shape of a reading says:
script_rendersper second far above the rate the data actually changes — anotifyis firing on things the reader cannot see. Condition it.script_rendersreasonable,mean_script_renderhigh — the boundary is too large. Split the View.mean_nativemost ofmean_script_render— the cost is in the host functions the description calls, not in the description. Read them once into fields beforerender, not per node.slowest_script_renderfar above the mean — one build is paying for something the rest are not: a collection materialized on first render, or a rarely-taken branch that describes far more than the common one. A mean that drifts as a whole is system load instead.
Where the Snapshot cache stops
The Snapshot removes the cost of no change. It does not remove the cost of a small change.
A Snapshot holds structure and values together:
StockRow
├── Symbol("AAPL")
├── Price("230.42")
└── Change("+1.42%")
When the price becomes 230.51, the structure is identical and only one leaf differs — but a new description is the only way to say so, so the whole View is described again: every div(), every .gap(), every .bg(), every crossing into Rust. That is the dirty-render path, and on a fast feed it is the one that runs.
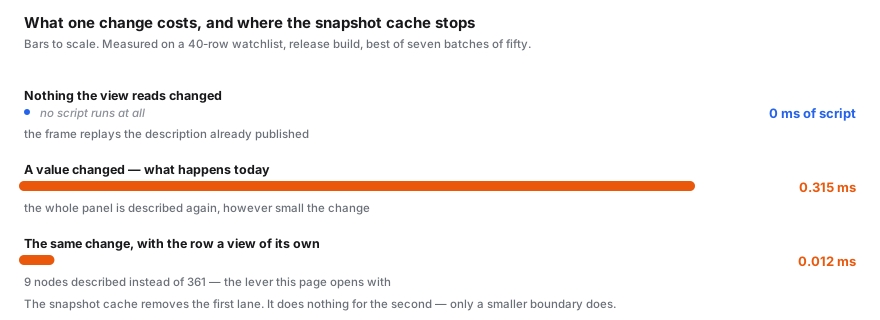
The lever is the one this page opens with: shrink the boundary that has to be rebuilt. On the watchlist above, describing the whole panel costs 0.315 ms and describing one row costs 0.012 ms — 361 nodes against 9. Putting the row behind a View of its own is what turns the first number into the second, and it is available today.
structure_repeats() and structure_changes() are how you check that the boundary is doing what you think. They count how often a rebuild produced the same shape as the description it replaced, differing only in the values inside it. A panel reporting a low rate is worth knowing about on its own: something in it is changing structure when you thought only a number was.