

The Engine Seam
The scripting engine sits behind one internal interface. Everything above it — the element description arena, the materializer, the call scope, the style table, the theme, the capability model, the overlay host, hot-reload — is engine independent, and only the engine module knows what a script value is.
cargo run -p gpui-shell -- examples/js_todolistQuickJS, via rquickjs — which vendors the quickjs-ng fork — is the engine that ships and the only one today. It sits behind a quickjs cargo feature all the same, and building with no engine is a compile error rather than a crate that exports nothing.
Why there is a seam at all
The engine choice is the one decision in this runtime that could not be settled on paper.
Everything else in the design follows from GPUI's element model and can be argued about with a whiteboard. The engine cannot, because the whole approach stands or falls on a single number: how long it takes script code to describe a realistic interface. Every method call in a builder chain is one crossing of the language boundary, and if that per-call cost is too high, no amount of design fixes it.
What the number is compared against changed once a script render stopped being a frame render. A description is built when application state moves and replayed by every frame until it moves again, so the cost below is paid per user action rather than per repaint. That makes the boundary cost matter less than it did — but it does not make it free, and it is still the number that would decide a second engine.
So the seam is a way of not having to be right in advance. The decision is made by measurement, and a second engine would be a new module rather than a rewrite.
JavaScript is the default for one reason, and it is a product reason rather than a technical one: application code reads better in it. With presentation owned by the script, the vast majority of an application is composing elements, writing styles and handling events — and the readability of that code decides whether the runtime is worth using. Classes, arrow functions, template literals and destructuring land squarely on that kind of code. The secondary benefit is that JavaScript is the best-covered language in model training data, which matters for one of the three settings.
The cost is stated rather than glossed over. QuickJS has no JIT — it is a bytecode interpreter, so hot loops and per-call costs will not beat a JIT-compiled engine on principle. That is a real trade, and the benchmark below is where it would show up if it mattered.
The measurement
There are three costs here, and treating them as one was the original mistake. The benchmark describes a 40 × 5 grid of styled cells — 443 description nodes, roughly ten recorded operations each — and reports each cost separately:
cargo test -p gpui-shell --release --lib benchmark -- --nocapture| What it measures | 443 nodes | Paid | |
|---|---|---|---|
| A | script → Snapshot | 1.4 ms | once per application change |
| B | Snapshot → GPUI elements | 0.7 ms | every frame |
| C | a full cached repaint | 1.8 ms, no JavaScript at all | every frame |
Run it in release or the figures mean nothing. Every absolute number on this page comes from a release build on a MacBook Pro (M3, 8 cores, 24 GB), and moves with the machine.
C is the one that is an assertion rather than a timing. Fifty repaints of an unchanged View run no JavaScript at all. If a single one of them ever does, the runtime has regressed to charging script cost per frame, and the benchmark fails rather than merely getting slower.
One size cannot show which of the three costs scale, so a fourth test walks the same panel up to 8,403 nodes. It sits behind --ignored because the largest size takes seconds:
cargo test -p gpui-shell --release --lib benchmark -- --ignored --nocaptureDescribing costs 1.1 ms at 443 nodes, then 5.1, 10.3 and 20.5 ms as the panel grows to 2,103, 4,203 and 8,403. A whole frame — B plus GPUI's layout and paint, which is what C measures — costs 1.3, 5.9, 12.0 and 27.0 ms. Both scale close to linearly with the node count. What does not scale is the JavaScript: no frame at any size runs a line of it. Three things that settles:
- 4,203 nodes is where the Snapshot decides the outcome. 12 ms a frame holds 60 FPS; rebuilding the description for every frame would cost 22 ms and drop them. Below that size both models have room to spare, which is worth knowing before reading too much into the ratio.
- The description cost did not vanish, it moved. 20 ms for 8,403 nodes is paid when the user acts rather than sixty times a second, but it is still 20 ms — which is why the per-call cost remains the number a second engine would be judged on.
- Past a few thousand nodes the bill is not script at all. 27 ms a frame at that size, with the VM untouched, is materialization, layout and paint. A View that large wants virtualizing; a faster engine would not move it.
Read A against the design's own budget — 1.5 ms for one script render — and it clears it, but with less room than hoped: the budget was derived from roughly 150 ns per recorded operation across 800 nodes, and the measurement reports about 320 ns across 443. A panel three times this size would not fit in one pass. What changed is how often that matters. At 120 FPS the old model would have spent 168 ms of every second describing an interface nobody had changed; the same panel now costs 1.4 ms when the user actually changes something, and 0.7 ms to repaint. The levers the design names for genuinely enormous panels — driving the per-call cost down, memoizing unchanged subtrees, virtualizing long lists — are still not implemented, and are now optimizations rather than prerequisites.
Two implementation choices came out of the same measurement and are visible in the runtime today:
- Elements are plain objects sharing one prototype, with the style methods installed on that prototype by a JavaScript prelude that loops over the name list. Not one class per element, not a fresh closure per property access, and not 3,000 Rust closures.
- The diagnostic
Proxyprototype is not the default. Wrapping the prototype in aProxyso a mistyped method can be named costs about 30% of the whole description pass, so the runtime keeps a plain prototype and re-runs a failed render once against the diagnostic one purely to produce the message. See Styling.
A live market-data workload
The synthetic benchmark isolates costs; a Longbridge market terminal exercises them together. The following sample used a release build in the active window on a 3,840 × 2,160 display running at 144 Hz. Its watchlist received live quote updates while the selected instrument's details and five-day price chart were visible. The target was 120 FPS, which gives each frame 8.33 ms.
Opt-in runtime counters sampled one-second intervals and separated script description work from native materialization:
| Measurement | Observed range |
|---|---|
Full JavaScript render plus Spec recording | 12.0–13.5 ms per dirty render |
| Snapshot materialization | 0.93–1.08 ms per materialization |
| Script renders caused by quote updates | 8–20 per second |
| Materializations while the window was active | 59–78 per second |
One active-window FPS HUD sample reported 69 FPS, 10.9 ms frame time and 18.3% dropped frames. That HUD measurement includes GPUI layout and paint and therefore is not directly interchangeable with either runtime counter, but it confirms the end-to-end workload was missing the 8.33 ms target.
The useful conclusion is narrower than “JavaScript is slow.” A clean Snapshot can be materialized in about 1 ms, comfortably inside the frame budget. A quote-driven dirty update, however, spends roughly 12–13.5 ms before that materialization is complete because the application rebuilds and records its full description. Repeatedly invalidating the root script View therefore dominates this workload; optimizing only the native materializer would not recover 120 FPS.
These figures deliberately exclude debug builds and samples taken after the window lost active status. Both change scheduling and frame presentation enough to make their FPS readings unsuitable for an architectural comparison. They are also a workload measurement, not a replacement for the reproducible crate benchmark above: quote frequency, visible content, hardware and display timing all affect the absolute result.
Threads and memory
The VM and GPUI's App share one thread — the main one — inside one process. ShellRuntime is an Rc with RefCell interiors, so it is neither Send nor Sync. There is no worker and no second VM.
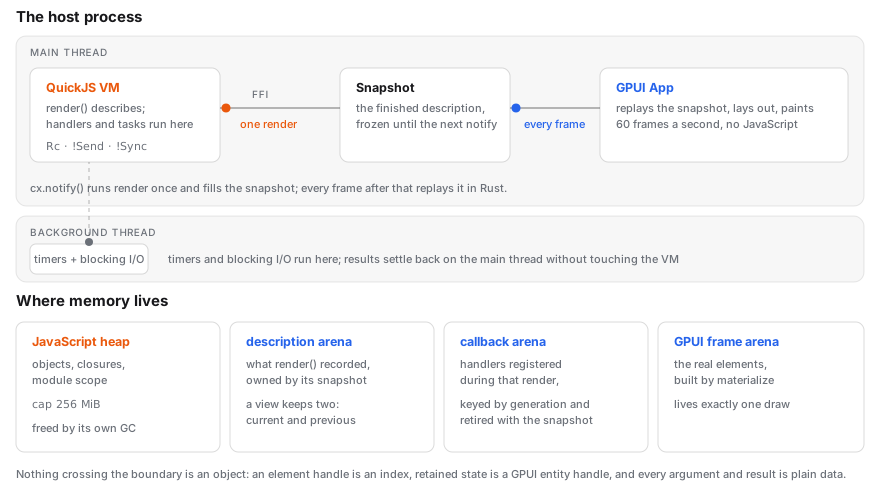
Background work never touches the VM. Timers (cx.sleep, cx.timer) count down there, and filesystem, process, fetch, TCP and WebSocket operations hand off their blocking work there. Results settle on the foreground executor, so JavaScript continuations still run on the main thread in a Task scope. GPUI also does its own work on its own threads once the elements exist.
Three consequences matter when profiling:
- A builder call is a function call. It crosses the FFI boundary and nothing else — no serialization, no IPC round trip, no copy beyond the conversion of the argument itself. The benchmark reports that cost per recorded operation, and across the four panel sizes it lands at 240–340 ns.
- Script work still shares the UI thread. Filesystem, process, fetch, TCP and WebSocket operations hand blocking work to background workers and settle on the foreground executor, but JavaScript computation and HostModule calls run beside GPUI and must stay bounded.
- A runaway script cannot be preempted from another thread. What cuts it off is the interpreter's own interrupt — 50 ms inside
render, 500 ms inside an event handler — and acatchblock cannot swallow it.
Memory splits four ways, each with a different owner and a different moment of release:
| What | Where it lives | Released when |
|---|---|---|
| Objects, closures, module scope | The QuickJS heap, capped at 256 MiB | Its GC runs, or the runtime drops |
| The element description arena | Rust; moved into the Snapshot it produced | That Snapshot drops |
| Registered callbacks | A Rust arena keyed by Snapshot generation | That Snapshot drops and retires its generation |
| GPUI elements | GPUI's own frame arena | The draw that built them ends |
A View holds two Snapshots rather than one: the live description, and the one it replaced. The previous is kept a generation longer because a frame already in flight may still be reading it, and releasing it early would retire callbacks that frame still needs.
Nothing that crosses the boundary is an object. An element handle is an integer index into the arena, retained host state — an InputState's rope, cursor and selection — lives in a GPUI entity the script addresses through a handle, and every argument and result is plain data.
What linking it costs
Two numbers a host has to know before it takes the dependency: how much bigger the binary gets, and how much more memory it holds.
Measured on the two smallest real programs in this repository, so the figures are the cost of this crate rather than the cost of whatever else an application happens to contain:
hello_world | gpui-shell running js_todolist | Added | |
|---|---|---|---|
| Binary, stripped | 12.6 MiB | 26.1 MiB | +13.5 MiB |
| Binary, unstripped | 16.5 MiB | 33.8 MiB | +17.3 MiB |
| Resident memory | 67 MiB | 81 MiB | +14 MiB |
hello_world is 41 lines of Rust over gpui and gpui-component — a window and a counter. The gpui-shell CLI is the smallest host that can run a script application; here it is running examples/js_todolist, 519 lines of JavaScript across four modules, with a live QuickJS runtime behind it. Memory is the median of four runs, discarding a first run that reads high while caches are cold; the binaries are --release with the workspace's default profile, stripped with strip(1).
The +13.5 MiB is a constant, and that is the most useful thing here. The same pair measured on the component gallery — a program five times the size — adds the same 13.5 MiB stripped, where it is +19.8% rather than +107%. Two independent measurements agreeing to three significant figures is what makes this a fact about gpui-shell rather than a reading of one application.
The memory rows look like they disagree and do not. On the gallery the difference is within measurement noise: that build reads 194–208 MiB across runs, and 14 MiB is simply below its own spread. The minimal program can resolve it because 67 MiB has less to hide it in.
Where the binary goes
Not mostly QuickJS. The interpreter is one to two megabytes; the rest is the Standard Runtime it arrives with. fetch, websocket and crypto bring hyper, rustls, ring, h2, a webpki root store and the compression crates, and gpui-component alone brings none of them — hello_world links no HTTP, no TLS and no tokio. The whole stack enters through this crate.
That also explains why an older measurement of this table read +4.7 MiB: it predates the Standard Runtime. fs, net, crypto, fetch, websocket and zlib all arrived after it.
There is no configuration that takes the element surface without them. quickjs is the only engine feature and it is default; building with --no-default-features is a compile_error!, and the Standard Runtime is inside that same feature. Splitting the two would be new work rather than exposing a switch that already exists.
Two savings that look available and are not, both measured rather than reasoned about:
- Dropping the five upstream crates Shell does not register —
llrt_fetch,llrt_fs,llrt_net,llrt_osandllrt_console, which were dependencies only for a compile-time assertion — changes the binary by zero bytes. Their heavy features resolve to crates other dependencies already pull. They are gone anyway, because 14 crates that cost nothing in bytes still cost compile time and supply-chain surface, and depending on an upstreamfetchthat Shell deliberately does not use reads as though it does. - Narrowing
reqwestto whatfetch.rsactually uses — droppingcharset,multipart,socks,streamandmacos-system-configuration, none of which that file can reach — saves 0.1 MiB.
So the 13.5 MiB is not slack. It is hyper, rustls, ring and the interpreter, and a host that wants any of fetch, websocket or crypto links all of it.
Per runtime
The figures above are for one runtime. A host that mounts several — a plugin host with one per plugin — pays the engine's construction each time: a QuickJS runtime and context, the module registry, the globals, the host installers, and a 43 KB prelude that is parsed on every construction. The 256 MiB heap cap from Capabilities is a ceiling, not a reservation; nothing is committed until a script allocates it.
What is on each side
The proportion is itself the argument for the seam: above it is the actual design, below it is "what does a script value look like".
| Above the seam — engine independent | Below the seam — what an engine implements |
|---|---|
The render Snapshot: what one script render produces and what frames replay | Converting an engine value to the runtime's neutral value type |
| The element description arena, single-use checking, and the debug tree | The module system's shape — ES modules and a resolver, versus require and a path list |
| Materialization: descriptions into real GPUI elements, pure Rust | Method dispatch — functions on a shared prototype, versus an __index metamethod |
The call scope: phases, generations, and the crate's only unsafe | The callback handle type |
| The style table, parametric styles and spelling suggestions | Converting the neutral error type into the language's own exception |
| The default token palette and colour token resolution | How a View is defined — class extends View, versus a metatable |
| The capability model and path resolution | The language-specific part of the sandbox |
| Length and colour coercion | |
| The neutral error type, the callback arena, the error overlay | |
ScriptView, ShellRoot, hot-reload |
None of the modules on the left names a VM anywhere in its source. That is what makes the seam real: it is not a trait, it is the fact that the rest of the crate reaches the engine through about a dozen entry points and nothing else.
A trait would actually be worse here. The two handle types — a View class and a View instance — carry lifetimes of their own on the QuickJS side, and forcing them through a trait would move that complexity into the type system without removing any of it.
The contract's load-bearing rule is about when, not what: the engine's build_snapshot is the only entry into script render, and nothing calls it per frame. An engine that rendered opportunistically — on a repaint, on a hover, on a timer — would put script cost back on the frame budget, which is the coupling the seam exists to prevent. Benchmark C is what would catch it.
Portability
If a second engine is ever added, scripts will not be portable between them. They would be different languages: a View is class Counter extends View in JavaScript and would be something else anywhere else.
What has to be the same is everything around them — the binding surface, the render protocol, the phase rules, the capability model, the error messages. The requirement the design imposes is behavioural: the same use case must produce the same description tree under either engine, and the same application activity must trigger the same number of script render calls. That is what would keep the seam from rotting into two divergent runtimes.
Known gap: async is not fully behind the seam
The seam's contract does not yet cover asynchronous work.
QuickJS requires the host to drain its job queue itself — nothing after an await runs until somebody asks — and that is not a shape every engine shares. So the scheduler cannot sit entirely above the seam. It needs two operations from an engine: turning a host task into something the script can await, and running the pending jobs.
Promise jobs are drained at host-call boundaries, and a render that merely notices pending jobs queues a foreground drain instead of executing arbitrary continuations on the paint path. That preserves the central invariant: an async continuation may invalidate a View, but a frame never re-enters JavaScript just because it is a frame.
Until both are addressed, the scheduler is QuickJS-specific. The rule it will be held to is the one that applies to any new capability: it goes above the seam unless it genuinely cannot be expressed there.
Why not WebAssembly, or a separate process
Two questions the seam invites.
gpui-shell runs the VM in the host process, on the main thread, alongside GPUI's App. That is what makes the 240–340 ns per recorded call possible at all. A separate process would put an IPC round trip on every recorded builder call, and there is no budget for one even at the reduced frequency Snapshots buy. For the same reason there is no Worker: the VM and the App are both main-thread only.
The wasm target is the other reason the seam is drawn where it is. QuickJS is plain C and compiles to WebAssembly; not every candidate engine does, and some generate machine code, which is a constraint on platforms that forbid writable-executable memory. Neither fact decides today's engine, but they are why "the engine is a parameter, not a part of the architecture" is written down at all.